Running a single-node Kubernetes cluster on bare metal means there is no built-in redundancy — no multi-node replication, no managed cloud snapshots. If the disk dies or a namespace is accidentally deleted, recovery depends entirely on backups. This article documents the full backup strategy: what is backed up, how, where, and how every backup run is monitored in real time.
A single backup approach fails in predictable ways. A Velero cluster snapshot doesn’t help if the host OS is corrupted. A raw file copy doesn’t capture the Kubernetes resource definitions needed to reassemble the cluster. The strategy is designed so that each layer covers a gap the others leave:
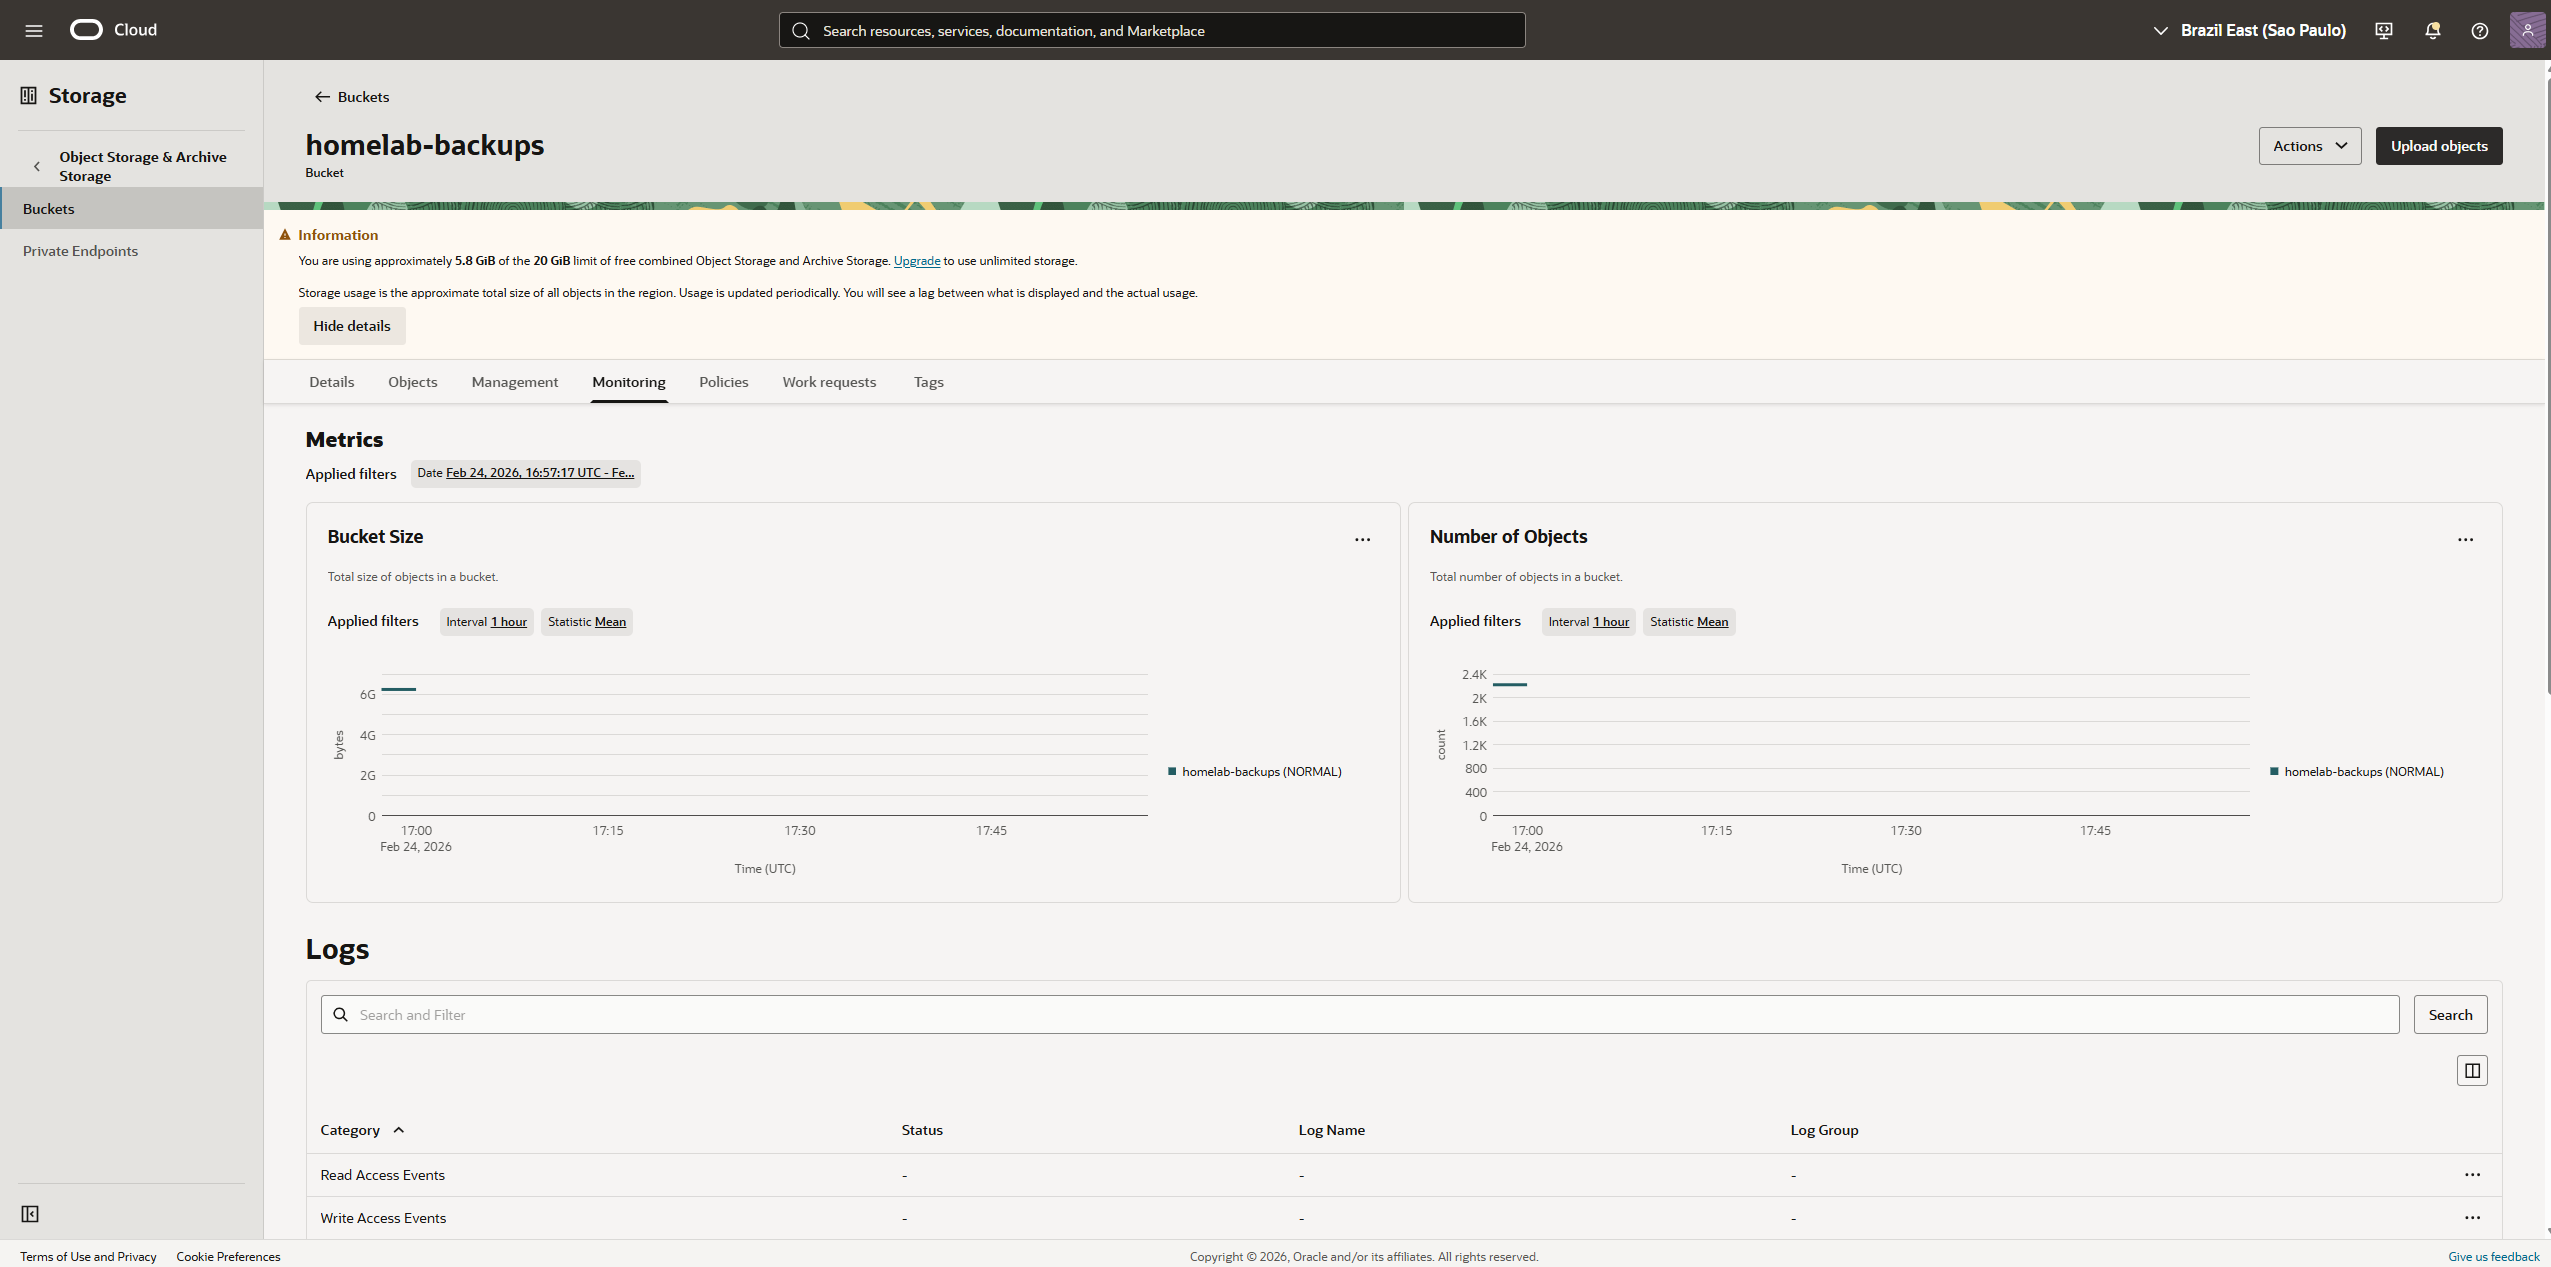
All remote backup data lands in Oracle Cloud Infrastructure (OCI) Object Storage, São Paulo region (sa-saopaulo-1). OCI’s Always Free tier includes 20 GB of object storage — enough to hold compressed, deduplicated backup repositories across all four layers.
Property
Value
Provider
Oracle Cloud Infrastructure
Region
sa-saopaulo-1 (São Paulo)
Storage class
Standard
Free tier
20 GB
Cost
$0
The bucket is organized by prefix, one per backup job:
Prefix
Job
velero/
Velero-managed Kopia repository
restic-k8s/
Raw PVC data (restic)
restic-host/
Host configuration (restic)
pg-dump/
PostgreSQL dump files
OCI access is configured through an API key pair. Credentials are stored as environment variables in the respective systemd service unit files and as a Kubernetes Secret for Velero’s BackupStorageLocation.
Velero originally used restic as its volume backup driver. Starting with Velero v1.10, Kopia became the recommended (and now default) driver. The reasons:
Feature
restic
Kopia
Deduplication
Chunk-level
Chunk-level
Encryption
AES-256
AES-256-GCM
Compression
No
Yes (zstd)
Parallel uploads
Limited
Yes (concurrent)
Repository locking
Pessimistic (slow)
Optimistic (fast)
Maintenance jobs
Manual
Automated
Kopia’s parallel upload capability and optimistic locking make it significantly faster for large PVCs. Automated maintenance (compaction, GC) keeps the repository size bounded without cron jobs.
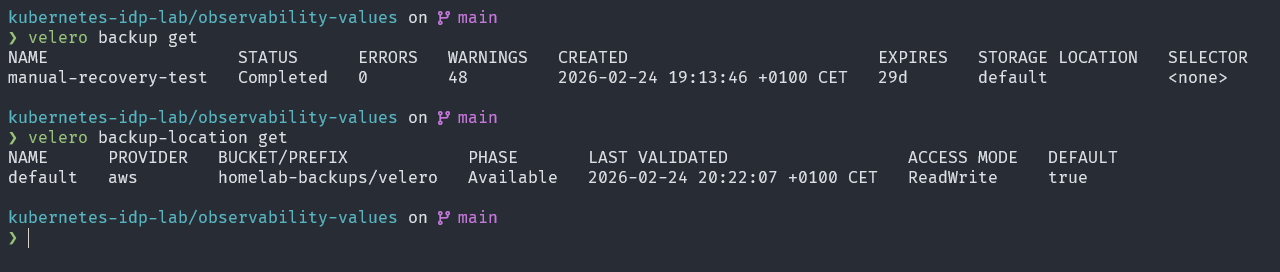
The velero pod orchestrates backup scheduling and communicates with the Kubernetes API to snapshot resource definitions. The node-agent DaemonSet runs on the host and mounts PVC directories directly from the local-path storage paths — bypassing the need for storage-provider snapshots.
After each backup, Velero triggers a maintenance job that runs compaction and garbage collection on the Kopia repository. These appear as short-lived pods in the velero namespace:
Velero covers Kubernetes-aware backups, but a second restic job backs up the raw PVC data on the host independently. This provides a safety net that doesn’t depend on Velero or the Kubernetes API:
/opt/local-path-provisioner/ ←── all PVC data, all namespaces
│
▼
restic backup
(systemd timer: daily)
│
▼
OCI Object Storage (restic-k8s/ prefix)
The backup uses a restic repository initialized directly in the OCI bucket. Restic deduplicates and compresses data before uploading, so only changed chunks are sent on each run.
The job is managed by a systemd timer (restic-k8s-backup.timer) that fires the restic-k8s-backup.service unit daily. After completing, the service pushes metrics to Prometheus Pushgateway:
Application data lives in the CloudNativePG-managed PostgreSQL cluster (postgres namespace). Even though the PVC data is backed up by both Velero (Layer 1) and restic (Layer 2), a logical dump adds an extra recovery option: restoring into a clean database instance without needing to replay a PVC snapshot.
A daily systemd timer runs pg_dumpall and writes the dump to the host filesystem. The dump file is then automatically included in the Layer 2 restic backup.
pg_dumpall (all databases)
│
▼
/var/backups/pg_dump/dump.sql
│
▼
Included in Layer 2 restic backup
│
▼
OCI Object Storage (restic-k8s/ prefix)
After each run, the dump size is pushed to Pushgateway:
Terminal window
pg_dump_size_bytes{job="pg_dump"}4823042
pg_dump_success{job="pg_dump"}1
pg_dump_duration_seconds{job="pg_dump"}8.2
The dump size trend in Grafana serves as an early warning: an unexpected drop indicates a database problem, an unexpected spike indicates unusual data growth.
The host OS and user configuration is backed up to a separate restic repository (restic-host/ prefix in OCI). This covers the files that wouldn’t exist in a Kubernetes PVC:
Path
Contents
/home/ifurlan
Shell configs, SSH keys, scripts, dotfiles
/etc
System configuration, network settings, systemd units
A separate restic repository is used (not the same as Layer 2) so that retention and exclusion policies can be tuned independently. Large binary files and cache directories are excluded via a .resticignore file.
After each run, metrics are pushed to Pushgateway:
A fifth systemd service (oci-bucket-stats.service) runs after all backup jobs and queries the OCI API to collect bucket-level statistics. These are pushed to Pushgateway:
The oci_bucket_limit_bytes metric represents the 20 GB OCI free tier ceiling. Tracking the total usage against this limit drives the OCIBucketNearLimit alert — fired when usage exceeds 85% of 20 GB.
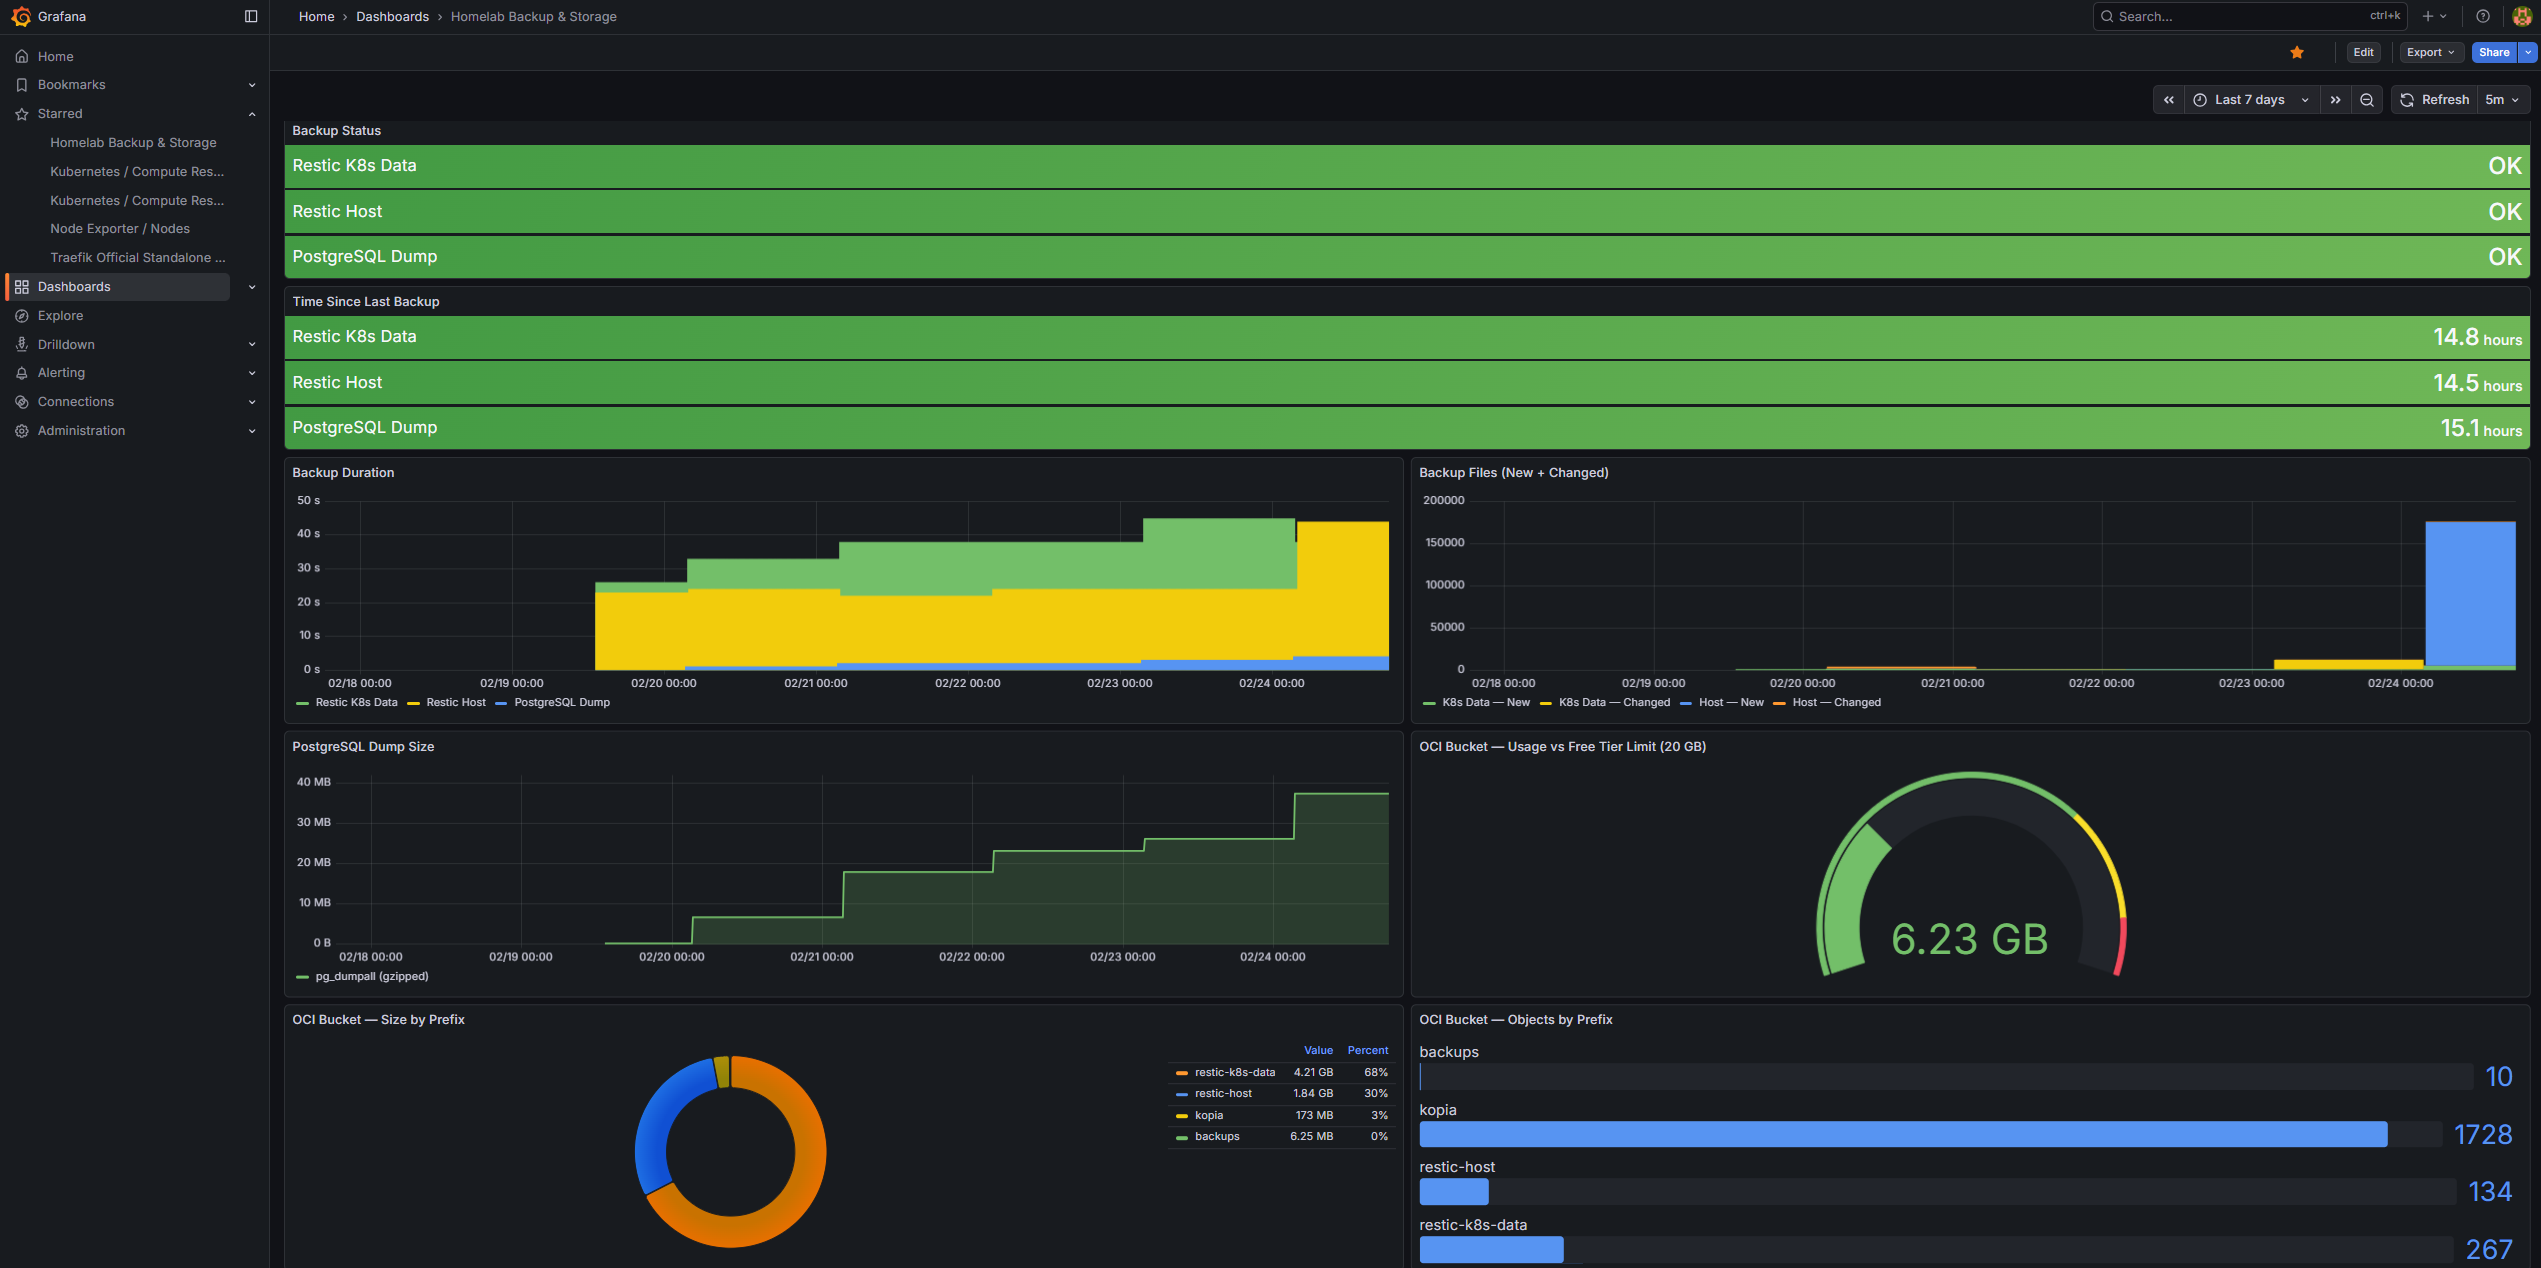
Every backup layer feeds metrics into Prometheus Pushgateway, making the full backup posture visible in Grafana. The custom “Homelab Backup & Storage” dashboard provides an at-a-glance view of backup health across all jobs.
Shows OK (green) or FAILED (red) for each backup job. Backed by backup_success from Pushgateway. The most important panels — any red is immediately actionable.
Jobs tracked: restic_k8s_data, restic_host, pg_dump
Time Since Last Backup
Type: Stat panels
Displays how long ago the last successful backup ran, derived from backup_timestamp. Color thresholds:
Green: < 25 hours
Yellow: 25–48 hours
Red: > 48 hours
Red here triggers the BackupStale alert in AlertManager.
Backup Duration
Type: Bar chart (time series)
Historical backup durations per job. Useful for spotting regressions — a job that suddenly takes 3× longer than usual may indicate a large new file, a slow OCI connection, or repository fragmentation.
Backup Files Changed
Type: Stacked bars
Shows files_new and files_changed per restic run. Helps understand backup churn — high change volume correlates with longer backup durations and higher OCI egress.
PostgreSQL Dump Size
Type: Line chart
Tracks pg_dump_size_bytes over time. The trend line shows database growth. A sudden drop is a red flag (backup or dump failure); gradual growth is expected and healthy.
OCI Bucket Usage vs Limit
Type: Gauge
Shows total OCI bucket usage against the 20 GB free tier ceiling. The gauge turns yellow at 85% and red at 95%, matching the OCIBucketNearLimit alert threshold.
OCI Bucket Size by Prefix
Type: Pie chart (donut)
Breaks down bucket usage by prefix (velero/, restic-k8s/, restic-host/, pg-dump/). Makes it easy to see which backup layer is consuming the most storage.
OCI Bucket Objects by Prefix
Type: Bar gauge
Shows the object count per prefix. Kopia/Velero tends to produce many small objects (chunks); a rapidly growing object count can indicate that maintenance jobs are not running.